Content:
- Quakes may well sharpen India’s seismic readiness
- The deeper meaning of declining school enrolment
Quakes may well sharpen India’s seismic readiness
Context and Recent Earthquake Events:
- On February 6, 2023, Türkiye and Syria experienced two massive earthquakes:
- First quake: 7.8 magnitude at around 4 a.m.
- Second quake: Struck nine hours later, intensifying destruction.
- Casualties: Over 17,000 deaths within minutes.
- January 7, 2025:
- A 7.1 magnitude quake hit Shigatse city, Tibet.
- Impact felt in Nepal and Northern India.
- Death toll: Between 126 and 400; 338 injured.
- February 17, 2025:
- Tremors felt in Delhi and Siwan (Bihar) within four hours of each other.
- Residents described it as the strongest tremor in recent memory.
Relevance : GS 1(Geography) , GS 3(Disaster Management)
Practice Question:“Earthquakes cannot be prevented, but preparedness can mitigate their impact.” Examine India’s seismic vulnerability, highlighting recent events. Suggest comprehensive measures to enhance India’s seismic readiness with reference to geography and disaster management.(250 words)
Understanding Fault Lines and Seismic Vulnerability:
- Fault Lines:
- Boundaries between 15 major tectonic plates; unpredictable and dangerous.
- They can remain dormant for decades or centuries before suddenly releasing built-up pressure.
- Indian Plate vs. Eurasian Plate:
- Collision created the Himalayas; zone remains highly active.
- Fault line extends from Kashmir to the Northeast, impacting Pakistan, Tibet, Nepal, and Bhutan.
India’s Seismic Reality:
- The Himalayan region is a high-risk seismic zone with increasing tectonic pressure.
- Popular perception of the Himalayas focuses on tourism and scenic beauty, ignoring seismic dangers.
- Seismologists warn that the plates have reached critical stress levels.
Infrastructure and Policy Shortcomings:
- Existing building codes are either inadequate or poorly enforced.
- Hydropower projects, dams, and roads in the Himalayas are vulnerable to landslides and glacial lake outbursts.
- Infrastructure development should prioritise seismic resilience.
- Insulation against projected damage is essential since predicting quakes is impossible.
Urgent Measures Needed:
Immediate Policy and Engineering Revisions:
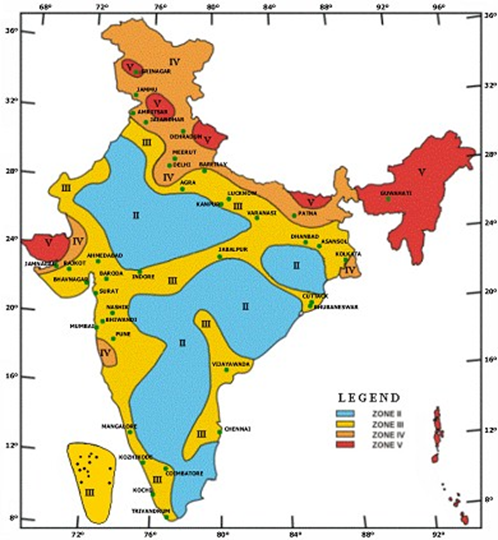
- Halt or reassess engineering activities that weaken earth’s crust in seismic zones (II, III, IV).
Updated Seismic Zonation & Infrastructure Mapping:
- Develop new vulnerability maps for high-risk structures (e.g., hydel projects, atomic reactors like Narora in Zone IV).
- Plan for evacuations, demolitions, and rebuildings where necessary.
Insurance Mechanisms:
- Create a seismic building insurance scheme to incentivize risk coverage.
Rescue & Rehabilitation Planning:
- Conduct zone-wise assessments for rescue operations and temporary shelters.
International Collaboration & Technology Integration:
- Partner with global experts for sensor technology and earthquake-resistant architecture.
Institutional and Governance Readiness:
- Ministry of Earth Sciences and the National Disaster Management Authority (NDMA) are crucial assets.
- Urgent need to mobilize institutional capabilities and allocate funds proactively.
Key Takeaways:
- Earthquakes cannot be prevented and rarely predicted, but preparedness is possible.
- India must prioritize seismic readiness over reactive post-disaster responses.
- The cost of preparedness is high, but cost of inaction is incalculably higher.
- The window of preparedness is open only until the next big quake strikes.
Conclusion:
- India must shed complacency and act decisively to safeguard vulnerable populations and infrastructure.
- Preparedness over panic should be the guiding principle.
- The question remains: Is India acting swiftly enough?
The deeper meaning of declining school enrolment
Demographic Context and Implications
- Demographic Dividend Window:
- India, as the world’s most populous country, has been positioned to benefit from its large youth population.
- The declining school enrolment suggests this window is closing, risking an ageing population before economic maturity.
Relevance : GS 1(Society ) , GS 2(Social Justice )
Practice Question:Discuss the implications of declining school enrolment on India’s demographic dividend and economic growth. Suggest measures to address the issue.(250 words)
- Population Trends:
- School-going population (6-17 years) declined by 17.3 million (5.78%) over the past decade.
- Elementary-level age group (6-13 years) declined by 18.7 million (9.12%); secondary-level (14-15 years) by 2.17 million (4.35%).
- Fertility rate dropped to 2.01 (2022), below the replacement level of 2.10, leading to fewer children entering schools.
School Enrolment Trends (2014-15 to 2023-24)
- Overall Decline:
- Total school enrolment fell by 24.51 million (9.45%) over the decade.
- Sharpest drop at elementary level: 18.7 million (13.45%) despite the RTE Act ensuring free and compulsory education.
- Secondary-level enrolment declined by 1.43 million (3.75%), while senior secondary enrolment increased by 3.63 million (15.46%), indicating recent onset of decline.
- Year-on-Year Trends:
- U-DISE+ data (2022-23 & 2023-24): 15.5 million (6%) drop since 2018-19.
- The decline is consistent and cannot be dismissed as a temporary or methodological anomaly.
Sector-wise Analysis (Government vs Private Schools)
- Government & Aided Schools (Mainstay of Marginalized Communities):
- Account for 65% of total enrolment.
- Government schools: 19.89 million (13.8%) decline; aided schools: 4.95 million (16.41%) decline.
- Elementary-level decline: Government schools 21.78 million (18.31%), aided schools 3.85 million (24.34%).
- Private Unaided Schools:
- 1.61 million (2.03%) overall enrolment increase.
- Marginal rise at elementary and secondary levels but significant growth in senior secondary (1.41 million, 15.55%), reflecting shifting parental preference for private schooling in higher grades.
Underlying Causes of Decline
- Demographic Factors:
- Strong positive correlation (60.36%) between enrolment and population in the 6-17 age group.
- Demographic shift explains the majority of the decline, overshadowing administrative explanations.
- Institutional Changes:
- Decline in the number of schools by 79,109 (5.1%) from 2017-18 to 2023-24, aligning with population trends and school consolidation policies.
- Methodological Changes (Official Explanation):
- Aadhaar-linked enrolment aimed at removing duplicate entries cited as a reason but insufficient to explain the widespread decline.
Socio-Economic and Long-Term Implications
- Impact on Human Capital Development:
- Reduced school enrolment compromises future workforce quality, innovation capacity, and economic competitiveness.
- Shrinking Working-Age Population:
- India risks following developed countries with an ageing population but without having secured adequate wealth, creating fiscal pressures.
- Pressure on Higher Education & Workforce Planning:
- Though senior secondary enrolment is stable, the foundational decline at the elementary level will cascade upwards, reducing future higher education cohorts.
- Equity Concerns:
- Declines in government school enrolment disproportionately affect the poor and marginalized, risking widened educational inequalities.
Way Forward
- Urgent Need for Census Data:
- Delays in the 2021 Census hinder evidence-based policy adjustments. Updated demographic insights are crucial.
- Policy Interventions:
- Expand early childhood education to attract and retain students in the system.
- Improve the quality of government schools to prevent mass migration to private institutions.
- Economic and Social Adjustments:
- Invest in skill development for the shrinking youth cohort to maximize productivity.
- Plan for elderly care infrastructure anticipating a growing ageing population.


