CONTENTS
- Global Hunger Index 2024
- Base Year Revision for India’s GDP
- Groundwater Recovery in Northern India Through Crop Rotation
- Enhanced Disaster Monitoring in Wayanad with X-band Radar Installation
- Nobel Prize in Chemistry 2024
- Murine Typhus
Global Hunger Index 2024
Context:
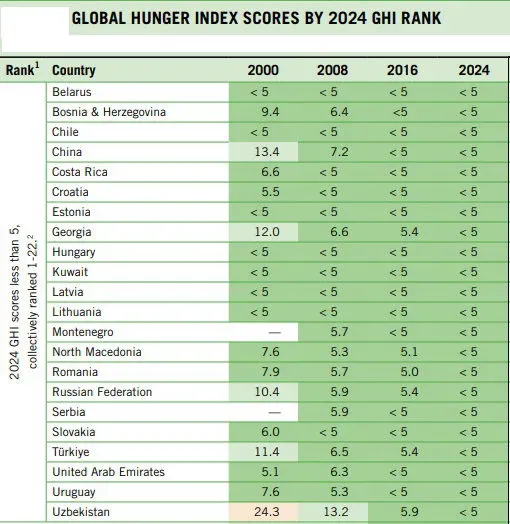
India’s struggle with hunger and malnutrition has been underscored by its ranking in the 2024 Global Hunger Index (GHI), where it stands 105th out of 127 countries with a score of 27.3, categorising it in the ‘serious’ range.
Relevance:
GS-II: Social Justice and Governance (Issues related to Hunger and Poverty, Government Policies and Interventions)
Dimensions of the Article:
- About Global Hunger Index (GHI)
- Key Insights from the 19th Global Hunger Index (GHI) 2024
- Addressing Hunger and Malnutrition in India
About Global Hunger Index (GHI)
- The Global Hunger Index (GHI) is a tool that measures and tracks hunger globally as well as by region and by country.
- The Global Hunger Index (GHI) prepared by European NGOs of Concern Worldwide and Welthungerhilfe.
- The GHI combines 4 component indicators:
- Undernourishment: the share of the population with insufficient caloric intake (data are from the UN Food and Agriculture Organization)
- Child stunting: the share of children under age five who have low height for their age (data are from UNICEF, the World Health Organization, the World Bank, and the Demographic and Health Surveys Program)
- Child wasting: the share of children under age five who have low weight for their height (data are from UNICEF, the World Health Organization, the World Bank, and the Demographic and Health Surveys Program)
- Child mortality: the mortality rate of children under age five (data are from the United Nations Inter-agency Group for Child Mortality Estimation).
- Countries are divided into five categories of hunger on the basis of their score, which are ‘low’, ‘moderate’, ‘serious’, ‘alarming’ and ‘extremely alarming’.
- The GHI is calculated annually, and its results appear in a report issued in October each year.
- Besides presenting GHI scores, each year the GHI report includes an essay addressing one particular aspect of hunger.
- The aim of the Global Hunger Index is to raise awareness and act against hunger to reduce hunger around the world.
Key Insights from the 19th Global Hunger Index (GHI) 2024
Overview and Theme
- Theme for 2024: “How gender justice can advance climate resilience and zero hunger.”
- Global Hunger Statistics: A slight improvement noted with a current GHI score of 18.3, down from 18.8 in 2016.
- Vulnerable Populations: Around 2.8 billion people globally cannot afford a healthy diet, underlining the widespread nature of food insecurity.
Regional Disparities
- Sub-Saharan Africa: Faces the highest rates of malnutrition and child mortality, exacerbated by ongoing conflicts in regions like Somalia and Sudan.
- South Asia: Countries including Afghanistan, India, and Pakistan are grappling with significant hunger challenges.
Core Issues and Successes
- Stagnation in SDG 2 (Zero Hunger by 2030): 42 countries are still facing alarming or serious levels of hunger, indicating a stall in progress towards this crucial global goal.
- Gender Disparity: Women’s access to resources is heavily impacted by discriminatory norms and violence, making them disproportionately vulnerable to food insecurity.
- Climate Change and Conflicts: These factors significantly disrupt food systems and agriculture, adding to the challenges in lower-income countries that also face heavy debt burdens.
- Progress in Crisis: Notably, countries like Mozambique and Nepal have shown significant improvements in their GHI scores since 2016, providing hope that advancements are possible.
Call to Action
- The GHI 2024 emphasizes the urgent need for global coordination to tackle the combined challenges of climate change, armed conflict, gender inequality, and economic instability. It highlights the crucial role of supporting vulnerable populations, especially women, in combating hunger.
India-Specific Findings from the GHI 2024
Child Malnutrition and Mortality
- Child Malnutrition: Alarmingly high rates with approximately 35.5% of children under five being stunted and 18.7% wasted.
- Child Mortality: Despite some progress, about 2.9% of children still die before their fifth birthday, with malnutrition being a significant contributing factor.
India’s Performance Trends
- Minimal Improvement: India’s GHI score moved from 29.3 in 2016 to 27.3 in 2024, showing minimal progress with persistent challenges in reducing overall hunger.
- Regional Comparison: India’s performance is notably poorer than neighboring countries like Sri Lanka, Nepal, and Bangladesh, which have fewer economic resources but better GHI scores.
Addressing Hunger and Malnutrition in India
Need of All Rounded Solutions
- Economically Insufficient: India’s earnest battle with hunger reveals that only economic growth is not a panacea to hunger.
- Need for Wider View: Solutions to the challenges of malnutrition are not in one sector alone and all must be involved.
Appropriate Strategies for Policy Implementation
- Food Security: Persistent vigilance is needed to make certain that all, especially women and children, access adequate and nutritious food.
- Access to Health Services: More investment in health care infrastructure is largely necessary for effective maternal and child health and nutrition service delivery.
- Maternal and Child Nutrition Program: Nutrition of women and children works clearly to provide targeted upturn within the vicious circle of nutritional deficiency.
- Major Programs: Initiatives such as the National Food security Act (NFSA) and PM POSHAN Scheme helps in gaps related to access and quality of food safety in India.
-Source: The Hindu
Base Year Revision for India’s GDP
Context:
Recently, MoSPI pulled together a team of economists and forecasters to deliberate on the issue of revising the base year for estimating GDP for India. This is in fact a demonstration of the firm commitment of MoSPI to broad-based consultation—a necessary expectation, given the controversies generated in the past by revisions of the base year. The last revision, in 2015, to change the base year from 2004-05 to 2011-12, came under methodological attack.
Relevance:
GS III: Indian Economy
Dimensions of the Article:
- Controversies Surrounding Base Year Revisions in GDP Calculation
- Understanding the Base Year Concept
- Reasons for the Update of the Base Year, Methods, and Stages of the Work
- Conclusion
Controversies Surrounding Base Year Revisions in GDP Calculation
Shift in Methodology
- The previous base year revision involved a significant methodological change where the computation of GDP for the private corporate sector (PCS) was directly sourced from the audited balance sheets from the Ministry of Corporate Affairs (MCA). This method was primarily used for estimating the manufacturing sector’s Gross Value Added (GVA).
- This revision process also phased out the use of traditional data sources like the Index of Industrial Production (IIP) and the Annual Survey of Industries (ASI).
Issues with the Deflator
- Critics have raised concerns about the use of a single deflator for converting nominal GDP growth into real GDP growth. This approach diverges from the double deflation method recognized internationally, which accounts for price changes in both outputs and inputs.
- The single deflator method typically adjusts the nominal value-added in each sector by broad price indices such as the Consumer Price Index (CPI) and Wholesale Price Index (WPI).
Discrepancies in GDP Measurement
- Despite robust reported GDP growth, signs of weak consumption suggest serious measurement discrepancies.
- This weakness in consumption might point to underreported economic activities and could reflect issues in the calculation of inflation within GDP metrics.
- A noted discrepancy exists between the production and expenditure methods of calculating GDP, highlighting potential inconsistencies in data.
Transparency and Coverage Concerns
- The rapid increase in registered companies, especially in the finance sector, over the past three decades has not transparently translated into measurable domestic output. Many of these entities do not file their audited balance sheets with the Registrar of Companies (RoC), obscuring their economic contributions.
- The 2015 revision faced backlash for utilizing balance sheets from the unorganized sector to compute GDP, which generally lacked detailed value-added data from production units. This led to reduced data coverage of informal sector producers, who are often not registered as formal companies.
Methodological Limitations
- The practice of averaging data from production and expenditure sides, while standard in advanced economies, poses challenges in developing contexts like India, where these two aspects of GDP are not independently measured.
- The data quality on the expenditure side, which includes consumption metrics, is considered to be suboptimal.
Understanding the Base Year Concept
Definition of a Base Year
- A base year serves as a specific reference point used to calculate Gross Domestic Product (GDP) figures for both subsequent and previous years.
- It acts as a stable benchmark for assessing economic performance, enabling consistent comparisons over time.
- The chosen base year should be typical, free from atypical events like pandemics or natural disasters, and not be too far removed from the present.
Reasons to Revise the Base Year
- GDP indicators are subject to change due to shifts in consumer behaviors, economic structures, and the types of commodities in use.
- Updates in data compilation methods and the integration of new classification systems necessitate periodic revisions to ensure GDP figures accurately mirror the current economic reality.
- Revisions can affect a wide range of economic indicators and lead to adjustments in recorded GDP levels.
Revision Frequency
- The United Nations System of National Accounts 1993 recommends revising computation practices periodically.
- Ideally, the base year should be updated every 5 to 10 years to align national accounts with the most current data.
- Since 1956, India has revised its base year seven times, with the latest shift from FY 2005 to FY 2012.
Reasons for the Update of the Base Year, Methods, and Stages of the Work
Setting Up the Advisory Committee
- In June 2024, the Ministry of Statistics and Programme Implementation (MoSPI) constituted a 26-member advisory committee on national accounts statistics (ACNAS), chaired by Biswanath Goldar.
- This committee shall determine how GDP measurement will be correlated with measurement of other economic indicators such as Wholesale Price Index (WPI), Consumer Price Index (CPI) and Industrial Production Index (IIP).
Selection of the New Base Year
- The committee is assuming 2022-23 as the new base year for viewing GDP calculations and also considering 2023-24 as an option.
- Such years, which have not been normal for measuring economy; such as 2016 (Demonetization), years 2017-18 (GST exercise – implementation effects) and years 2019-21 (COVID-19 pandemic) are all ruled out.
Incorporating New Data Sources
- A debate is also underway on the applicability of the Goods and Services Tax (GST) revenue streams for the GDP computation to provide a better outlook of the economy.
- Other potential modifications include incorporating the Annual Survey of Unincorporated Sector Enterprises (ASUSE) and the double deflation technique to improve the reliability of GDP figures.
Conclusion
MoSPI’s proactive stance in establishing an advisory committee to oversee the revisions is a reflection of the need for transparency and methodological precision in the computation of GDP. It is expected that these aspects, including bringing in new data sources and improving the calculations, will enhance the quality and credibility of the estimates of GDP of India.
-Source: Business Times
Groundwater Recovery in Northern India Through Crop Rotation
Context:
Research out of Indian Institute of Technology Gandhinagar estimates that if about 40% of the area under rice is replaced by other crops that require less water, then between 60 and 100 cubic kilometers of groundwater depleted in northern India since the year 2000 can be recovered.
Relevance:
GS I: Geography
Dimensions of the Article:
- Highlights
- What are the Difficulties Encountered in Practicing Sustainable Agriculture in India?
Highlights:
- Today’s agriculture especially growing of rice has a high dependency on ground water as source of irrigation.
- Continuous rise of temperatures globally will expound the existing ground water depletion- estimated to be about between 13 to 43 cubic km of water loss.
- Continued sequence of these and similar types of cropping systems will place severe strain on the already tapped and overexploited resources of groundwater which will worsen the issue of water security further.
- Because of the obesity the agriculture practice causes to the depletion of ground water, overhauling methods of farming is potent and all stakeholders should heed to the call.
Effect of Climate Change:
- Considering IPCC scenarios whereby the global average atmospheric temperature is expected to rise by 1.5 to 3 degrees Celsius the regions of Tropics are likely to maintain the current land use practices cropping patterns resulting in an increased degree of groundwater deficit recovery loss in the estimates of
- The 2018 report on Global Warming of 1.5°C from the Intergovernmental Panel on Climate Change (IPCC) projected that within the year 2050 to 2030, there will be a likelihood of temperature increase of 1.5°C due to global warming as more factors will have contributed to the warming with a possibility of reaching 3°C warming by 2100.
Observations:
- The report points out that there is an immediate need to modify cropping systems in particular Punjab, Haryana and Uttar Pradesh, so that the aquifers are not depleted, while the farmers’ profit is not adversely affected.
- It recommends rice cultivation in Uttar Pradesh, oilseed in West Bengal while suggesting rice intercrops in both the states.
- These recommendations are critical in policy context as they present suitable cropping systems in terms of groundwater preservation that also considers the farmers’ income in irrigated areas of north India.
What are the Difficulties Encountered in Practicing Sustainable Agriculture in India?
- The agricultural sector’s excessive focus on water consuming crops and ineffective irrigation practices has led to depletion of groundwater reserves and scarcity of water.
- Climate change challenges such as erratic rainfall, increasing temperatures and the prevalence of extreme climatic conditions such as floods and droughts decrease crop productivity and pose risks to agricultural sustainability.
- The presence of small and scattered farms inhibits the adoption of sustainable agriculture, mechanization, and the efficient use of resources.
- Environmental concerns and the negative impact on agricultural productivity in the long run have arisen from the widespread use of chemical fertilizers, pesticides and herbicides, which has increased water and soil pollution.
- The lack of adequate government policies and support mechanisms promoting the adoption of sustainable agriculture practices provides a major setback for ecological undertakings in agriculture.
-Source: Economic Times
Enhanced Disaster Monitoring in Wayanad with X-band Radar Installation
Context:
Following catastrophic floods and landslides that resulted in over 200 fatalities in Kerala’s Wayanad district in July 2024, the Union Ministry of Earth Sciences has approved the installation of an X-band radar in the district. This decision was prompted by a severe landslide above Punchirimattom, near the Mundakkai region, where a torrential downpour led to significant debris flow, exacerbating the disaster’s impact. The deployment of the X-band radar is aimed at improving the region’s weather forecasting and monitoring capabilities to better anticipate and manage such natural disasters.
Relevance:
GS III: Disaster Management
Dimensions of the Article:
- How do radars work?
- What is an X-band radar?
- How many radars does India have?
- What is NISAR?
How do radars work?
- Radar is short for ‘radio detection and ranging’. The device uses radio waves to determine the distance, velocity, and physical characteristics of objects around the device.
- A transmitter emits a signal aimed at an object whose characteristics are to be ascertained (in meteorology, this could be a cloud).
- A part of the emitted signal is echoed by the object back to the device, where a receiver tracks and analyses it.
- Weather radar, also known as a Doppler radar, is a common application of this device.
- The Doppler effect is the change in frequency of sound waves as their source moves towards and away from a listener.
- In meteorology, Doppler radars can reveal how fast a cloud is moving and in which direction based on how the cloud’s relative motion changes the frequency of the radiation striking it.
- A pulse-Doppler radar can measure the intensity of, say, rainfall by emitting radiation in pulses and tracking how often they’re reflected to the receiver.
- This way, modern Doppler radars can monitor weather conditions and anticipate new wind patterns, the formation of storms, etc.
What is an X-band radar?
- Doppler radar relies on Rayleigh scattering, when the scatterer is much smaller than the wavelength of the radiation.
- A radar trying to ‘see’ smaller particles like rain droplets or fog will need to use radiation of lower wavelengths, like in the X-band.
- An X-band radar is radar that emits radiation in the X-band of the electromagnetic spectrum: 8-12 GHz, corresponding to wavelengths of around 2-4 cm (this is in the microwave part of the spectrum.)
- The smaller wavelengths allow the radar to produce images of higher resolution. However, the greater the frequency of some radiation, the faster it will be attenuated. So X-band radars have a relatively shorter range.
- In Wayanad, the new radar is expected to be able to monitor the movements of particles, such as soil, to inform landslide warnings.
- The device will also perform high temporal sampling, that is, rapidly sample its environs, allowing it to spot particle movements happening in shorter spans of time.
How many radars does India have?
- The India Meteorological Department (IMD) started using radar for weather applications in the early 1950s.
- The first indigenously designed and manufactured X-band storm detection radar was installed in 1970 in New Delhi. In 1996, IMD replaced 10 outdated X-band radars with digital X-band radars.
- In its X-band radar network, India has both wind-finding and storm-detecting radars, and some with dual capabilities. The country also uses S-band radars (2-4 GHz) for long-range detection.
- The first S-band cyclone detection radar was installed in Visakhapatnam in 1970 and the first locally made variant was commissioned in Mumbai in 1980.
- In September 2024, the Ministry of Earth Sciences said India is set to have 56 additional Doppler radars in a few years.
- Recently, the Union Cabinet cleared the ₹2,000-crore ‘Mission Mausam’ to upgrade meteorological infrastructure in the country. This includes installing up to 60 meteorological radars until 2026 under the Mission’s first phase.
- Minister of State for Earth Sciences Jitendra Pradhan said in August in Parliament that the government has started the process to procure and install 10 X-band Doppler radars to improve weather forecasting in the northeast States and in Himachal Pradesh’s Lahaul and Spiti district.
- The initiative to install an X-band radar in Wayanad included installing a C-band radar (4-8 GHz) with an observational range of 250 km in Mangaluru.
What is NISAR?
- NASA and the Indian Space Research Organisation (ISRO) are currently developing a satellite called NISAR, short for ‘NASA-ISRO Synthetic Aperture Radar’.
- It will use radar imaging to produce a high-resolution map of the earth’s landmasses.
- Its payload consists of an L-band radar (1.25 GHz, 24 cm) built by NASA and an S-band radar (3.2 GHz, 9.3 cm) built by ISRO. Together they will track and record changes in the earth’s various natural processes.
- It is currently expected to be launched onboard an ISRO GSLV Mk II rocket in 2025, at a total cost of $1.5 billion, the bulk of it borne by NASA.
-Source: The Hindu
Nobel Prize in Chemistry 2024
Context:
Recently, the Nobel Prize in Chemistry 2024 was awarded by the Royal Swedish Academy of Sciences.
- One half of the prize is given to David Baker for computational protein design while the other half is given jointly to Demis Hassabis and John M. Jumper for protein structure prediction.
Relevance:
GS III: Science and Technology
Dimensions of the Article:
- What are the Contributions of David Baker?
- What Are the Contributions of Demis Hassabis and John Jumper?
What are the Contributions of David Baker?
- Baker’s research has envisaged a revolutionising in protein engineering; the group has designed proteins from the molecular level with the aid of computation, which changes the scope of protein engineering.
- His team developed proteins that have never existed in nature by combining the 20 unique amino acids that make up proteins in previously unseen ways.
- Implications in Medicine and Engineering: These constructed proteins are extremely useful scope wise mainly in the field of drugs, vaccines, nanomaterials and biosensors development.
- David Baker has achieved protein design beyond existing capabilities, for instance, designing sylvaneth that can break down plastics or do functions not even natural proteins can do.
- First Breakthrough in 2003: The first major milestone for Baker came in 2003 when his group was able to produce a protein which was not found in nature before.
What Are the Contributions of Demis Hassabis and John Jumper?
- Protein Folding Problem: Since the 1970s the problem of how any string of amino acids curls into pre defined three dimensional shapes has been of challenge to scientists.
- Structural biology is critical given the fact that the structure of a protein dictates its function.
- In these fields, particularly in drug design and development, treatment of diseases and biotechnology, understanding these structures is very important.
- Solution with AlphaFold2: In 2020, Jumper and Hassabis presented AlphaFold2 which is an artificial intelligence system for predicting protein structures that set a new standard.
- Given this, the model managed to resolve the structure of about 200 million proteins which is more than 97% of the known proteins predicted by the model.
- This accomplishment achieved so far rendered inconsequential several issues that had persisted for half a century in the structural biology discipline.
- Normal methods of resolving the protein cover including x-ray crystallography are very inefficient, tedious and long.
- Widespread Use and Impact: AlphaFold2 has been used by over two million researchers worldwide, enabling breakthroughs in numerous fields.
- For example, it has been instrumental in understanding antibiotic resistance and creating enzymes capable of breaking down plastics.
-Source: Indian Express
Murine Typhus
Context:
A 75-year-old man from Kerala who recently travelled to Vietnam and Cambodia was diagnosed with the bacterial disease murine typhus.
Relevance:
Facts for Prelims
Murine Typhus Overview:
- Murine typhus is an infectious disease caused by the flea-borne bacterium, Rickettsia typhi.
- Transmission:
- It is a common occurrence that infected fleas bite a human thus causing transmission.
- Other causes of this condition include endemic typhus as well as flea-borne spotted fever.
- Common rats, house mice, and simply mongooses are known hosts for this illness.
- The fleas infesting the disease-causing rodents may also infest other small mammals including household pets like cats and dogs. Once an infected flea bites a host, the infested flea can transmit R typhii for the rest of its lifespan.
- For instance, mucous membranes may also become infected with rickettsiae through contacting infected flea excreta.
- When contaminated excreta are introduced into any skin cuts, the disease is transmitted.
- Murine typhus is not contagious between persons nor does it pass from man to fleas.
- Afflicted countries report that the disease mostly occurs in coastal and insular tropics and subtropics where there are many rats.
- In the country of India, there are some incidences of murine typhus in the northeastern region, Madhya Pradesh as well as in Kashmir region.
Symptoms
- Symptoms typically develop within seven to 14 days post-exposure, and include a fever, headaches, aches in the body, pains in the joints, nausea and vomiting, and stomach pains.
- Later on, some may develop epidermal lesions.
Treatment
- There is no vaccine currently available against the disease.
- Doxycycline is usually offered for treatment, but the word treatment implies that the diagnosis is made early.
-Source: The Hindu