CONTENTS
- The PDS Impact on Household Expenditure
- Monitoring of Transport Vehicles
The PDS Impact on Household Expenditure
Context:
The Public Distribution System (PDS) is a crucial social security initiative in India aimed at ensuring food security. Currently, under the National Food Security Act (NFSA) of 2013, up to 75% of the rural population and 50% of the urban population are eligible for subsidised foodgrains. By reducing the cost of these foodgrains, households can allocate more resources to other food items, other nutrient and protein-rich foods. An empirical question is whether households diversify their food consumption as a result.
Relevance:
GS3-
- Food Security
- Public Distribution System
Mains Question:
Discuss the significance that the Public Distribution System (PDS) holds for India’s population. Has PDS led to an allocation of resources towards diversification of food choices for households? (15 Marks, 250 Words).
Household Consumption Expenditure Survey (HCES) 2022-23:
- The upcoming data from the Household Consumption Expenditure Survey (HCES) for 2022-23 will renew interest in studying the impact of free food from the PDS on expenditure for other food items.
- Regarding representativeness, the HCES:2022-23 collected information on both food and non-food items received by households through various social welfare programmes.
- Detailed information is available in the HCES:2022-23 report by the National Sample Survey Office (NSSO) on the Ministry of Statistics and Programme Implementation website, specifically on pages 15 to 18.
- The survey aims to provide insights into the characteristics of households receiving benefits rather than precise estimates of beneficiaries for each scheme.
- Typically, survey estimates of programme coverage are lower than administrative data suggests. Common issues in PDS literature include inclusion errors (ineligible households consuming PDS resources) and exclusion errors (eligible households not consuming PDS foodgrains).
- Researchers will compare the survey data on households consuming PDS items with NFSA coverage data.
Significance of Survey Data:
- While interpreting these estimates requires caution, the survey data is valuable for examining the characteristics of households reporting benefits from the programmes.
- Unless detailed information is obtained about the nature of an ailment or disease in the case of health shocks, and fee waivers or reimbursements in education, it is not possible to impute the value of free medical and education services received by households.
- The NSSO conducts separate surveys for education and health, gathering detailed information on out-of-pocket expenses and free services availed by households.
- Some may wonder why data on household payments cannot be used to impute the value of medical services.
- Insurance products are considered investments, not consumption, and relevant information is collected in the All India Debt & Investment Survey, not the HCES.
- To aid analysts and researchers, the NSSO has decided for the first time to impute the value of selected food and non-food items received for free.
- This allows for the calculation of two metrics: the Monthly Per Capita Consumption Expenditure (MPCE) of a household, which is the ratio of monthly consumption expenditure to household size, and the value of household consumption in a month considering the imputed value of free food and non-food items, termed ‘MPCE with imputation’. Both metrics are published by the NSSO in its report.
Imputation of Values:
- The NSSO has proposed two sets of values for each state and sector (rural and urban) to impute the value of food and non-food items received for free: the modal unit price and the 25th percentile unit price.
- While consumption expenditure refers to out-of-pocket spending, the value of consumption includes both free and subsidized items used by households.
- In its report, the NSSO used the modal price for imputing values only for items received free, not subsidized items.
- Therefore, no imputation is done for food items purchased from the PDS at regulated nominal prices.
- The main item that many households received for free was foodgrains from the PDS.
- At the all-India level, about 94% and 95% of the imputed value in rural and urban areas, respectively, is attributable to food items.
- When considering all households, including those that did not receive any free items, the imputed value for food is ₹82 in rural areas and ₹59 in urban areas.
- The NSSO report includes the average value of MPCE among various fractile classes, which are divisions of the population based on their MPCE.
- For the bottom 5% of the MPCE distribution, the average MPCE is ₹1,373 in rural areas and ₹2,001 in urban areas. This means that 5% of Indians have an MPCE below these amounts.
- When examining the imputed value of consumption for those at the lower end of the rural distribution, it is found that 20% of individuals in the bottom 5% actually belong to the next higher class (5%-10%), representing about 86 lakh people in rural India.
- Similar upward movement patterns are observed up to the sixth fractile class in rural areas and in urban areas as well.
Conclusion:
Since the report’s release, there has been ongoing debate about where to set the poverty line. A key issue to consider is whether to estimate the number of poor households based on their expenditure alone or based on the total value of their consumption, including the value of free items they receive. It is evident that in-kind social transfers significantly impact the well-being of households at the lower end of the consumption or income distribution.
Monitoring of Transport Vehicles
Context:
On July 10, in Uttar Pradesh, a private double-decker bus collided with a milk tanker, resulting in 18 fatalities. Local reports indicated that the bus’s insurance had not been renewed and it lacked an alarm system to alert the driver if the bus drifted from its lane, among other issues. If the State government’s inquiry confirms these details, they will underscore the complex nature of road safety.
Relevance:
GS3- Industry and Infrastructure
Mains Question:
In the context of rising road accidents of transport vehicles, examine the corelation between factors of road safety and accidents. What can be done to minimise such incidents in the future? (15 Marks, 250 Words).
Road Safety:
- Road safety encompasses factors such as road and highway design, the presence of roadside businesses, speed and access control, and visibility, all crucial for protecting lives.
- These findings should also draw attention to the reluctance of municipal authorities and local bodies to scrutinize public and licensed private infrastructure until after lives are lost.
- According to the National Crime Records Bureau, in 2022, 1.71 lakh people died, and 4.23 lakh were injured in 4.46 lakh road accidents.
- A 2023 IIT Delhi report estimated 11.3 road-accident deaths per lakh population in 2021, highlighting a public health crisis exacerbated by data inconsistencies and underreporting.
Road Accidents in India-2022:
Number of Road Accidents:
- In 2022, India experienced a total of 4,61,312 road accidents, resulting in 1,68,491 fatalities and 4,43,366 injuries.
- Compared to the previous year, these figures reflect an 11.9% increase in accidents, a 9.4% rise in fatalities, and a significant 15.3% surge in injuries.
- Road safety is a global issue, with 1.3 million deaths annually from road crashes. Notably, nearly one in four road deaths worldwide occurs in India.
- According to WHO data, approximately 3,00,000 people are killed on Indian roads each year, equating to more than 34 deaths every hour, and this is a conservative estimate.
- The number of individuals suffering life-altering injuries from road crashes is even higher.
Road Accident Distribution:
- 32.9% of accidents occurred on National Highways and Expressways.
- 23.1% on State Highways.
- 43.9% on other roads.
- 36.2% of fatalities happened on National Highways.
- 24.3% on State Highways.
- 39.4% on other roads.
Demographic Impact:
- Young adults (18-45 years) comprised 66.5% of the victims in 2022.
- Individuals in the working age group (18-60 years) accounted for 83.4% of total road accident fatalities.
Rural vs. Urban Accidents:
- 68% of road accident deaths occurred in rural areas.
- 32% occurred in urban areas.
Vehicle Categories:
- Two-wheelers had the highest share of total accidents and fatalities for the second consecutive year.
- Light vehicles (cars, jeeps, taxis) ranked second.
Road-User Categories:
- Two-wheeler riders made up 44.5% of fatalities.
- Pedestrians were the second-largest group, with 19.5% of fatalities.
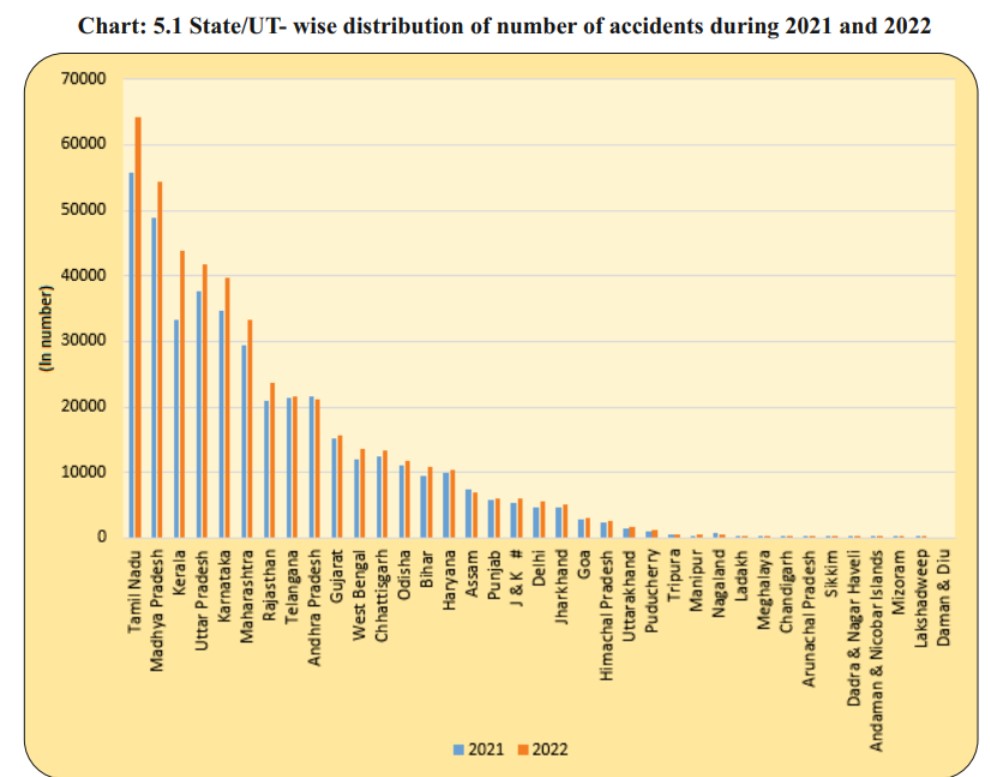
State-Specific Data:
- Tamil Nadu recorded the highest number of road accidents in 2022 (13.9% of total accidents), followed by Madhya Pradesh (11.8%).
- Uttar Pradesh had the highest number of road accident fatalities (13.4%), followed by Tamil Nadu (10.6%).
- Understanding these state-specific trends is crucial for implementing targeted interventions.
- Speed control is particularly critical, as it is a major factor in most fatal road accidents in the country. Following the bus accident, police reported that the collision had ejected passengers from the bus.
- Public officials are aware of measures to control speed in urban and rural areas, such as strategically placed speed-breakers, roundabouts, and increased police monitoring.
- Additionally, it should be clear which portions of the Automotive Industry Standards were violated by the bus’s condition at the time of the accident.
Way Forward:
There are three ways forward.
- First, local authorities must enforce existing standards with skilled personnel and proper equipment.
- They should be empowered to impose harsher penalties on transport service operators who fail to meet safety requirements.
- Municipal bodies must be prevented from diluting standards specified by engineers to facilitate local businesses.
- Second, the Ministry of Road Transport and Highways needs to collect and publish more comprehensive data on vehicle registrations, safety certificates, testing centers, criteria, and reports and audits.
- It also needs to improve the quality of data on injuries and deaths, both of which are currently undercounted.
- Finally, there needs to be greater public awareness of how the health of transport vehicles is assessed and access to each vehicle’s latest test report.
- This might be challenging due to general complacency towards quality control and unscrupulous operators evading sanctions, but it is a necessary step to ensure safety.
Conclusion:
The approach to road safety must be proactive, not reactive. The public plays an equally important role as the government. A collaborative and dedicated effort from both the government and citizens can reduce road accidents and save precious lives.