CONTENTS
- India-Saudi Arabia Strategic Partnership Council Meeting
- Global Shifts in Online News Consumption
- Unprecedented August 2023 Rainfall Deficit Challenges India’s Water Resources
- E-waste Management
- Global Biofuels Alliance
- Salem sago
- Phanigiri artefacts
India-Saudi Arabia Strategic Partnership Council Meeting
Context:
Saudi Arabia’s Crown Prince Mohammed bin Salman Al Saud and PM Modi co-chaired the first summit-level meeting of the India-Saudi Arabia Strategic Partnership Council (SPC). The Saudi Crown Prince is on a daylong State Visit to India post the G20 Summit.
Relevance:
GS II: International Relations
Dimensions of the Article:
- India-Saudi Arabia Strategic Partnership Council (SPC)
- Key Outcomes of Recent Meeting
- India-Saudi Arabia Bilateral Relations
India-Saudi Arabia Strategic Partnership Council (SPC):
- The agreement to establish the India-Saudi Arabia Strategic Partnership Council (SPC) was signed during Prime Minister Modi’s visit to Saudi Arabia in October 2019.
- The SPC was created to provide a high-level framework for steering and enhancing the bilateral relationship between the two countries.
Pillars of SPC:
The SPC consists of two primary pillars:
- Committee on Political, Security, Social, and Cultural Cooperation: This committee focuses on various aspects of political, security, social, and cultural cooperation between India and Saudi Arabia.
- Committee on Economy and Investments: This committee is dedicated to economic and investment-related matters.
Functional Levels:
Both sub-committees, Political, Security, Social, and Cultural Cooperation, and Economy and Investments, operate at four functional levels of engagement:
- Summit Level: Involves discussions and decisions at the highest level, typically between the Prime Minister of India and the Crown Prince of Saudi Arabia.
- Ministerial-Level: Includes discussions and coordination among relevant ministers from both countries.
- Senior Officials’ Meetings: Involves senior officials from both sides convening to discuss and plan cooperation.
- Joint Working Groups (JWGs): Specialized working groups that focus on specific areas of cooperation and facilitate practical collaboration.
Key Outcomes of Recent Meeting:
- West Coast Refinery Project: India and Saudi Arabia decided to expedite the implementation of the $50-billion West Coast refinery project. This project involves the construction of a 60 million tonnes refinery-cum-petrochemical complex on the Maharashtra coast.
- Areas for Intensified Cooperation: Energy, defense, semiconductor, and space were identified as areas for intensified cooperation. Additionally, cooperation in security, education, technology, transportation, healthcare, tourism, and culture were highlighted.
- Comprehensive Energy Partnership: Both sides agreed to diversify their existing hydrocarbons relationship into a comprehensive energy partnership.
- Pacts Signed: During the meeting, the two countries signed eight pacts to boost cooperation in various areas, including digitization and investment.
Indian Community in Saudi Arabia:
Size and Significance:
- The Indian community in Saudi Arabia is approximately 2.2 million strong, making it the largest expatriate community in the Kingdom.
Economic Contribution:
- Indians make up around 7% of the population of Saudi Arabia, and they play a significant role in the country’s economic growth and development.
Integration of Migration Systems:
- During Prime Minister Modi’s visit to Riyadh in October 2019, it was announced that India’s e-Migrate system would be integrated with Saudi Arabia’s e-Thawtheeq system.
- This integration aims to streamline the migration process for workers, enhancing the efficiency of labor mobility between the two countries.
Hajj Pilgrimage:
- The annual Hajj pilgrimage is another important component of Indo-Saudi bilateral relations. Saudi Arabia hosts millions of pilgrims from around the world, including India, during this religious event.
- During the visit of the Saudi Crown Prince to New Delhi in February 2019, it was announced that India’s Hajj quota would be increased by 24,975 in 2019. This increase allowed 200,000 Indians to perform Hajj in August 2019, strengthening the cultural and religious ties between the two nations.
India-Saudi Arabia Bilateral Relations:
Historical Ties:
- India and Saudi Arabia share a history of cordial and friendly relations, rooted in centuries-old economic and socio-cultural connections.
Diplomatic Relations:
- Diplomatic relations between the two countries were established in 1947, and since then, there have been numerous high-level visits that have strengthened the bilateral ties.
Recent Key Visits:
- 2010 – Riyadh Declaration: During the visit of then-Indian Prime Minister Manmohan Singh to Saudi Arabia in 2010, the ‘Riyadh Declaration’ was signed. This declaration elevated the bilateral relationship to a ‘Strategic Partnership,’ signifying its growing importance.
- 2016 – Highest Civilian Honor: In 2016, King Salman of Saudi Arabia conferred the Kingdom’s highest civilian honor on Prime Minister Narendra Modi during his visit.
- 2019 – Investment Commitment: During Crown Prince Salman’s visit to India in February 2019, Saudi Arabia announced its decision to invest approximately US$100 billion in India, signifying a significant economic partnership.
- 2019 – Strategic Partnership Council Agreement: During Prime Minister Modi’s visit to Riyadh in 2019, the Strategic Partnership Council (SPC) Agreement was signed, further solidifying the strategic and multifaceted relationship between the two nations.
Economic Cooperation between India and Saudi Arabia:
| Trade: | In the fiscal year 2022-23, the bilateral trade between India and Saudi Arabia reached a record high of $52.75 billion. India’s exports to Saudi Arabia increased to $10.7 billion, up from $8.8 billion in 2021-22. Saudi Arabia is India’s second-largest trading partner, while India is Saudi Arabia’s fourth-largest trading partner. |
| Investment: | Indian investments in the Kingdom of Saudi Arabia have amounted to approximately USD 2 billion. Saudi Arabia is the 18th largest investor in India, with investments totaling $3.14 billion as of March 2022. During the visit of the Saudi Crown Prince to India in February 2019, it was announced that Saudi Arabia would invest $100 billion in India across various sectors. |
| Energy Partnership: | Energy cooperation is a cornerstone of the bilateral relations between India and Saudi Arabia. Saudi Arabia plays a crucial role in ensuring India’s energy security. Saudi Arabia remained India’s third-largest source for crude oil and petroleum product imports in the fiscal year 2022-23. India imported 39.5 million metric tons (MMT) of crude oil from Saudi Arabia in FY23, accounting for 16.7% of its total crude imports. Additionally, India’s LPG imports from Saudi Arabia stood at 7.85 MMT, making up 11.2% of its total petroleum product imports in FY23. |
| Defence Partnership: | In December 2020, the Chief of Naval Staff of India, General Manoj Mukund Naravane, made a landmark visit to Saudi Arabia. Two editions of the bilateral naval exercise “Al Mohed al Hindi” have been conducted to date. Both countries also have close cooperation in the defense industry and capacity building. These aspects of economic, energy, and defense cooperation underscore the multifaceted and strategic nature of the relationship between India and Saudi Arabia, contributing to mutual growth and development. |
-Source: The Hindu
Global Shifts in Online News Consumption
Context:
The 2023 Digital News Report by the Reuters Institute reveals notable changes in global online news consumption. The Reuters Institute focuses on studying journalism’s future through research, debate, and engagement on a global scale.
Relevance:
GS III: Role of Media & Social Networking Sites in Internal Security Challenges
Dimensions of the Article:
- Changing News Consumption Patterns in India
- Challenges Faced by India Due to Changes in News Consumption Patterns
- Way Forward for Addressing News Consumption Challenges in India
Changing News Consumption Patterns in India:
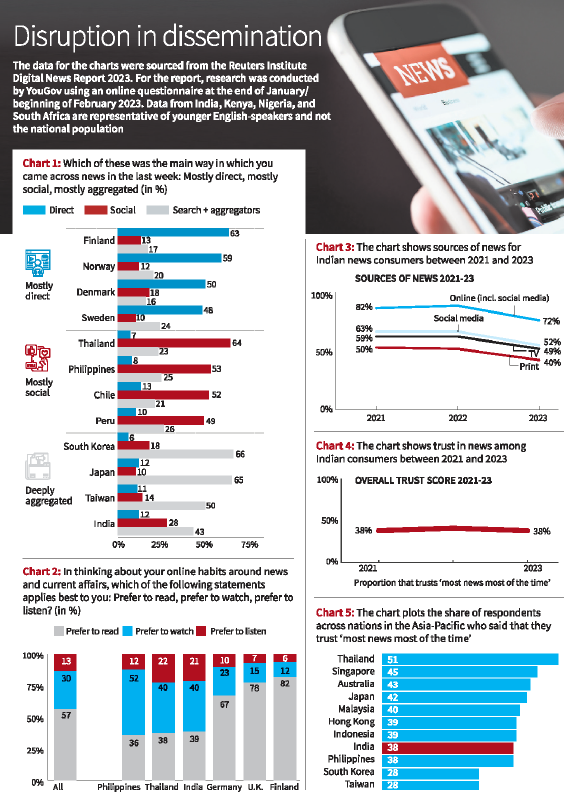
- Shift Away from Traditional Websites: Indians increasingly rely on search engines and mobile news aggregators (43%) for online news, moving away from traditional news websites.
- Preference for Social Media: Only 12% prefer direct sources like newspapers, while 28% opt for social media as their primary news source.
- Preference for Visual Content: A preference for watching or listening to news content over reading it is observed.
Global Contrasts in News Consumption:
- Scandinavia’s News Engagement: Scandinavian countries maintain direct engagement with established news brands.
- Social Media Dependence: In Asia, Latin America, and Africa, there is heavy reliance on social media for news.
- Diverse News Consumption Preferences Across Countries:
- Reading Dominance: Finland and the UK show a preference for reading news online (80%).
- Video News Preference: India and Thailand prefer watching news online (40%), while the Philippines leads with 52% favoring video news.
Declines in News Engagement in India:
- Falling Access to Online News: Alarming declines are seen in both reading and sharing news in India, with online news access dropping by 12% between 2022 and 2023.
- Television Viewership Decrease: Television viewership, especially among younger and urban individuals, has decreased by 10%.
- Impact of Post-Covid Period: The decline in news engagement can be attributed, in part, to the diminishing influence of the Covid-19 pandemic since the relaxation of lockdown measures in April 2022.
Trust in News in India and Globally:
- Stagnant Trust Levels in India: Trust in news in India remains stagnant at 38% between 2021 and 2023, ranking among the lowest in the Asia-Pacific region.
- Varying Trust Levels Globally: Countries like Finland (69%) and Portugal (58%) exhibit higher trust levels.
- Political Polarization and Trust: Countries with higher levels of political polarization, such as the United States (32%), Argentina (30%), Hungary (25%), and Greece (19%), tend to have lower trust levels in news.
Challenges Faced by India Due to Changes in News Consumption Patterns:
Misinformation and Fake News Spread:
- Shift away from traditional sources to search engines and social media may facilitate the dissemination of misinformation and fake news, leading to public confusion, false beliefs, and potential social unrest.
Impact on Journalism Quality:
- Reduced preference for traditional news outlets can affect the quality of journalism.
- Independent and credible journalism may face financial challenges, potentially resulting in a decline in investigative reporting and in-depth analysis.
Political Polarization:
- The prominence of social media as a news source can contribute to political polarization.
- Exposure to biased information may impact the democratic process by reinforcing echo chambers and ideological divisions.
Low Trust in News:
- India’s persistently low trust in news raises concerns for a healthy democracy.
- Rebuilding trust in the media is crucial for informed citizenship and a functioning democracy.
Generation Gap in News Consumption:
- Decreasing television viewership among younger individuals highlights a disconnect with traditional news mediums.
- Engaging and informing the younger generation through reliable news sources is essential for their civic education.
Algorithmic Determination of Content:
- Relying on search engines and social media for news exposes individuals to content determined by algorithms.
- This may limit exposure to diverse perspectives and important news stories, potentially affecting their understanding of complex issues.
Way Forward for Addressing News Consumption Challenges in India:
Media Literacy Programs:
- Promote media literacy programs in schools and communities to empower individuals with the skills to critically evaluate news sources and discern misinformation from credible information.
Collaborative Fact-Checking:
- Encourage partnerships between fact-checking organizations, government agencies, and social media platforms to collectively identify and correct false information disseminated online.
Legislation for Fair Compensation:
- Explore the possibility of enacting legislation similar to Australia’s model, which mandates digital platforms to pay local media outlets for using their content.
- This can support the struggling news industry, ensure fair compensation for content creators, and incentivize the production of authentic and original news content.
-Source: The Hindu
Unprecedented August 2023 Rainfall Deficit Challenges India’s Water Resources
Context:
In August 2023, India, heavily dependent on monsoon rains, faced an exceptional challenge with a severe rainfall deficit. This deficit has led to a significant drop in water levels in the country’s vital reservoirs, sparking concerns about water supply for households, industries, and power generation. Historically, August is a month of substantial reservoir water storage increase, but 2023 witnessed the driest August in over a century. Instead of the anticipated 255 mm of rainfall, India received only about 162 mm, resulting in a substantial 36% rainfall deficiency.
Relevance:
GS I: Geography
Dimensions of the Article:
- India’s Reservoir Water Levels – August 2023
- Consequences of Water Scarcity in India’s Reservoirs
- Causes for Rainfall Deficit in India
India’s Reservoir Water Levels – August 2023:
- Live Storage: As of August 31, 2023, the Central Water Commission (CWC) reported that the live storage in 150 reservoirs was 113.417 billion cubic meters (BCM), which represented 63% of their total live storage capacity.
- Comparison to 2022: This storage level was approximately 23% lower than the storage during the same period in 2022.
- Comparison to 10-Year Average: It was also around 10% lower than the average storage of the last 10 years.
- Regional Variations: The water levels in these reservoirs varied across different regions and river basins in India.
- Southern Region: The southern region, which experienced a rainfall deficiency of 60% in August, had the lowest storage level at 49% of its combined capacity.
- Eastern Region: In contrast, the eastern region, which received normal rainfall, had the highest storage level at 82% of its combined capacity.
Basins with Deficient Water Levels:
- Highly Deficient Basins:
- Pennar basin in Karnataka and Andhra Pradesh.
- Mahanadi basin in Chhattisgarh and Odisha.
- Deficient Basins:
- Subarnarekha, Brahmani, and Vaitarni basins in Jharkhand, West Bengal, and Odisha.
- Kaveri basin in Karnataka and Tamil Nadu.
- Mahi basin in western India.
- Krishna basin in Maharashtra, Karnataka, and Telangana.
Overall Trend:
- Water storage in the reservoirs across the eastern, western, central, and southern regions (except the northern region) was lower compared to the previous year (2022).
Consequences of Water Scarcity in India’s Reservoirs:
Impact on Agriculture:
- Reduced water availability in the reservoirs can adversely affect crop production, especially during the rabi (winter) season.
- Farmers’ incomes may be at risk due to diminished irrigation water.
Energy Generation Challenges:
- The reservoirs play a crucial role in supplying water for hydropower generation, which accounts for over 12% of India’s total electricity production.
- Dry conditions in August led to increased power demand, primarily for irrigation, resulting in record-high power generation.
- To meet the demand, additional electricity production from coal-fired power plants may be required due to the declining water levels in the reservoirs.
Ecological Impact:
- Reservoirs also support biodiversity and provide ecosystem services like flood control, groundwater recharge, fisheries, and recreational activities.
- Lower water levels can disrupt these functions and lead to ecological damage, impacting both natural habitats and human activities.
Year-Round Water Supply Threatened:
- India relies heavily on annual rainfall, primarily during the southwest monsoon season.
- The declining water storage in reservoirs threatens year-round water supply for households, posing challenges to daily life and water security.
Causes for Rainfall Deficit in India:
El Niño:
- Definition: El Niño is a climatic phenomenon characterized by the rise in sea surface temperatures in the central and eastern Pacific Ocean, causing disruptions in global weather patterns.
- Impact on India: El Niño typically leads to reduced rainfall in India during the monsoon season.
- Current Status: According to the India Meteorological Department (IMD), El Niño was present during August 2023 and was expected to persist until September.
- Future Outlook: While the IMD forecasts that rainfall in September may not be more than 10% deficient, the growing strength of El Niño in the equatorial Pacific Ocean poses a significant risk to India’s water resources.
Indian Ocean Dipole (IOD):
- Definition: The Indian Ocean Dipole (IOD) is a climate pattern marked by differences in sea surface temperatures between two regions in the Indian Ocean – a western pole in the Arabian Sea and an eastern pole in the eastern Indian Ocean south of Indonesia.
- Impact on Climate: IOD significantly influences the climate in countries surrounding the Indian Ocean Basin and plays a vital role in rainfall variability in the region.
- Current Status: While the IMD expected the IOD to become favorable for monsoon rainfall, it did not have a substantial impact on the monsoon this year.
-Source: The Hindu
E-Waste Management
Context:
The Indian Cellular and Electronics Association (ICEA) has published a report titled ‘Pathways to Circular Economy in the Indian Electronics Sector.’ This report emphasizes the pressing requirement to reconsider e-waste management and identifies potential opportunities for its utilization. According to the report, this shift could create an additional market opportunity worth USD 7 billion.
Relevance:
GS III: Environment and Ecology
Dimensions of the Article:
- Major Highlights of the ICEA Report on E-Waste Management in India
- Proposed Strategies for a Circular Economy in E-Waste
- Status of E-Waste Management in India
- Strategies for Reducing and Recycling E-Waste Effectively in India
Major Highlights of the ICEA Report on E-Waste Management in India:
Current E-Waste Landscape:
- Predominantly Informal: Approximately 90% of e-waste collection and 70% of recycling in India are managed by an informal sector in a competitive environment.
- Informal Sector Strengths: The informal sector excels in salvaging spare parts from older electronic devices and performing profitable repairs.
- Industrial Hubs: Certain industrial hubs like Moradabad specialize in processing printed circuit boards (PCBs) to extract valuable materials like gold and silver.
Shift Towards Circular Economy:
- China’s Example: The report points to China, aiming to incorporate 35% of secondary raw materials into new product manufacturing by 2030, as a model for embracing a circular economy approach.
Proposed Strategies for a Circular Economy in E-Waste:
Public-Private Partnerships (PPP):
- Collaboration between government entities and private companies is crucial to share the costs of establishing a reverse supply chain.
- This involves collecting devices from users, erasing personal data, and directing them for further processing and recycling.
Transparent Database:
- Creating a transparent and auditable database of materials collected through the reverse supply chain enhances accountability and traceability.
Geographical Clusters:
- Establishing geographical clusters where discarded devices are gathered and dismantled can optimize the recycling process, increasing efficiency and cost-effectiveness.
High-Yield Recycling Facilities:
- Encouraging the development of high-yield recycling facilities can maximize the extraction of value from electronic products, including rare earth metals in semiconductors.
Policy Recommendations:
- Promoting Repair: Encouraging repair and extending product lifespans, possibly by supporting a user’s right to repair, to reduce the environmental impact of electronic waste.
Status of E-Waste Management in India:
- Electronic waste (e-waste) encompasses all old, end-of-life, or discarded electrical and electronic equipment, including household appliances and office information and communications devices.
- Toxic Components: E-waste contains hazardous chemicals and metals like lead, cadmium, mercury, and nickel.
E-Waste in India:
- Global Ranking: India is currently ranked third globally among the largest e-waste generators, following China and the United States.
- Surge in Volume: The volume of e-waste in India surged significantly to 1.6 million tonnes in 2021-22.
- Concentration: 65 cities in India generate over 60% of the total e-waste, with 10 states contributing to 70% of the total e-waste generated.
E-Waste Management Framework in India:
- Regulations of 2008: E-waste management in India was initially addressed within the framework of the Environment and Forests Hazardous Wastes (Management and Handling) Regulations of 2008.
- E-Waste Rules of 2010: In 2011, important regulations known as the E-waste (Management and Handling) Regulations of 2010 were issued under the Environment (Protection) Act of 1986, featuring Extended Producer’s Responsibility (EPR).
- E-Waste Rules of 2016: In 2017, the E-waste (Management) Rules, 2016 were enacted, including more than 21 products under their scope, such as Compact Fluorescent Lamps (CFLs) and other mercury-containing devices.
- Amendment in 2018: In 2018, the 2016 rules were amended to expand their scope, emphasizing authorization and product stewardship, focusing on the responsibility of producers and stakeholders throughout a product’s life cycle.
- E-Waste Rules of 2022: The Government of India introduced the E-Waste (Management) Rules, 2022, with the primary goal of digitizing the e-waste management process and enhancing visibility.
- Hazardous Substances Restriction: The rules also restrict the use of hazardous substances (e.g., lead, mercury, cadmium) in manufacturing electrical and electronic equipment to mitigate their adverse impact on human health and the environment.
Strategies for Reducing and Recycling E-Waste Effectively in India:
Comprehensive Regulatory Framework:
- Create a comprehensive regulatory framework for e-waste collection that includes mandatory registration and licensing of collection centers and recyclers to formalize and standardize the process.
Tax Credit System for Manufacturers:
- Implement a tax credit system to incentivize electronics manufacturers to design products with extended lifespans and repairability features.
- Encourage eco-friendly design practices while discouraging planned obsolescence.
E-Waste ATMs:
- Install E-Waste ATMs in public places, allowing individuals to deposit old electronic devices in exchange for small financial incentives or vouchers for public transportation or essential goods.
- Incorporate educational displays on these ATMs to raise awareness about e-waste recycling.
Blockchain-Based Tracking System:
- Establish a blockchain-based system to track the entire lifecycle of electronic devices.
- Assign each device a digital certificate to record its manufacturing, ownership, and disposal history, simplifying traceability and accountability for improper disposal.
Promote Awareness Through Art Installations:
- Encourage artists to create sculptures or exhibits in public spaces using e-waste materials.
- These art installations visually depict the scale of the e-waste problem and serve as a means to raise awareness about proper disposal and recycling.
-Source: Down To Earth
Global Biofuels Alliance
Context:
Recently, the Prime Minister of India announced the launch of the Global Biofuels Alliance.
Relevance:
GS II: International Relations
Dimensions of the Article:
- Global Biofuels Alliance
- Significance of the Alliance
- Biofuel
Global Biofuels Alliance:
The Global Biofuels Alliance is an initiative led by India, with the goal of forming an alliance consisting of governments, international organizations, and industry stakeholders to promote the adoption of biofuels.
Membership:
- The alliance has garnered participation from a total of 19 countries and 12 international organizations. Among the participants are both G20 member countries and non-member countries.
- Founding members of the alliance include India, Brazil, and the United States.
Objectives:
- The primary objective of the Global Biofuels Alliance is to facilitate cooperation and promote the use of sustainable biofuels, particularly in the transportation sector.
Significance of the Alliance:
The alliance holds several key significance factors:
- Market Strengthening: It aims to strengthen biofuels markets, facilitate global trade in biofuels, share policy lessons, and provide technical support for national biofuels programs worldwide.
- Capacity Building: The alliance will support the global development and deployment of sustainable biofuels by offering capacity-building exercises along the entire biofuels value chain and technical assistance for national programs.
- Virtual Marketplace: It will establish a virtual marketplace to assist various stakeholders, including industries, countries, ecosystem players, and technology providers, in mapping demand and supply and connecting technology providers with end users.
- Standards and Regulations: The alliance will also facilitate the development, adoption, and implementation of internationally recognized standards, codes, sustainability principles, and regulations to incentivize the adoption and trade of biofuels.
Biofuel:
- Biofuel is a type of fuel produced from biomass within a relatively short timeframe, in contrast to the slow natural processes involved in the formation of fossil fuels like oil.
- Biomass refers to organic materials, primarily derived from plants and animals, which can be used as a source of energy.
Generations of Biofuel:
First Generation:
- First-generation biofuels are produced from consumable food items that contain starch (e.g., rice and wheat) or sugar (e.g., beets and sugarcane) for bioalcohols, as well as vegetable oils for biodiesel.
- These biofuels are primarily derived from crops that are traditionally considered food sources.
Second Generation:
- Second-generation biofuels are mainly obtained from non-food feedstocks, such as agricultural residues, forest biomass, and industrial waste, as well as used vegetable oils.
- This generation of biofuels focuses on using non-food sources to avoid competition with food production.
Third Generation:
- Third-generation biofuels, often referred to as “algae fuel,” are derived from algae and can take the form of both biodiesel and bioalcohols.
- Algae-based biofuels are seen as a more sustainable and efficient source of bioenergy.
Fourth Generation:
- Fourth-generation biofuels are also produced from non-arable land, similar to third-generation biofuels.
- However, unlike third-generation biofuels, fourth-generation biofuels do not require the destruction of biomass, making them more environmentally friendly and sustainable.
-Source: Times of India
Salem Sago
Context:
Recently, the Salem Starch and Sago Manufacturers Service Industrial Cooperative Society Ltd. (popularly called SAGOSERVE) received a Geographical Indication Tag, or GI Tag, for Salem sago.

Relevance:
GS III: Indian Economy
Dimensions of the Article:
- Salem Sago
- Geographical Indications (GI) Tag
Salem Sago:
- Sago is a product derived from raw tapioca.
- It is typically found in the form of small, hard globules or pearls, characterized by their pearl-white color.
- Sago is manufactured from the wet starch powder obtained from crushed tapioca roots.
- The wet starch powder is the primary material used in the production of sago, while the dry powder has various industrial applications.
Tapioca:
- Tapioca is a significant horticultural crop cultivated across nearly 3 lakh hectares in Tamil Nadu, yielding around 60 lakh tonnes of the crop.
Climate and Soil Requirements:
- Tapioca thrives in well-drained soil, particularly red lateritic loamy soil.
- It grows best in a tropical, warm, and humid climate.
- Adequate rainfall, with well-distributed precipitation exceeding 100 cm per annum, is essential for tapioca cultivation.
- This crop can be successfully cultivated up to an elevation of 1000 meters above sea level.
Geographical Indications (GI) Tag
Definition and Importance:
- Geographical Indications of Goods indicate the country or place of origin of a product.
- They assure consumers of the product’s quality and distinctiveness derived from its specific geographical locality.
- GI tags are an essential component of intellectual property rights (IPRs) and are protected under international agreements like the Paris Convention and TRIPS.
Administration and Registration:
- Geographical Indications registration in India is governed by the Geographical Indications of Goods (Registration and Protection) Act, 1999.
- The registration and protection are administered by the Geographical Indication Registry under the Department of Industry Promotion and Internal Trade (DIPIT), Ministry of Commerce and Industry.
- The registration is valid for 10 years, and it can be renewed for further periods of 10 years each.
Significance and Examples:
- GI tags provide a unique identity and reputation to products based on their geographical origin.
- The first product in India to receive a GI tag was Darjeeling tea.
- Karnataka has the highest number of GI tags with 47 registered products, followed by Tamil Nadu with 39.
Ownership and Proprietorship:
- Any association, organization, or authority established by law can be a registered proprietor of a GI tag.
- The registered proprietor’s name is entered in the Register of Geographical Indication for the applied product.
- Protection and Enforcement:
- Geographical Indications protect the interests of producers and prevent unauthorized use of the product’s name or origin.
- Enforcement of GI rights helps maintain the quality and reputation of the products associated with their specific geographical regions.
Location of the Geographical Indications Registry:
- The Geographical Indications Registry is located in Chennai, India.
-Source: The Hindu
Phanigiri Artefacts
Context:
The Phanigiri artefacts, dating from 200 BCE-400 CE and discovered in 1942, are on display at the New York Metropolitan Museum of Art.

Relevance:
GS I: History, Facts for Prelims
Phanigiri Artefacts:
Phanigiri Buddhist Site:
- The Phanigiri Buddhist site is considered one of the most significant discoveries in Buddhist iconography in the current millennium.
- Phanigiri, meaning “hillock of snake hood,” is a small village located in the state of Telangana.
Key Findings:
- The archaeological findings at Phanigiri include thoranas, which are elaborately decorated gateways or arches.
- These thoranas discovered at Phanigiri are of great importance because they are among the first of their kind found south of Sanchi, a renowned Buddhist site in central India.
Mahayana and Hinayana Depictions:
- A notable feature of the thorana at Phanigiri is that it contains a panel depicting both Mahayana and Hinayana schools of Buddhist thought. This reflects the diverse Buddhist influences present at the site.
Deification of Buddha:
- Phanigiri provides evidence of the transition from the deification of Buddha to his canonization and ritualization.
- This shift in perception of Buddha’s identity from a historical and spiritual figure to a more formal and ritualized one is an important aspect of Buddhist evolution.
Buddha’s Image:
- One of the significant findings at Phanigiri is an image of the Buddha wearing what appears to be a Roman toga, with intricately carved folds. This image is made of limestone.
-Source: The Hindu